Transformation, Entities, Properties, Physics, Parameters, Order of Magnitude (TE3PO)
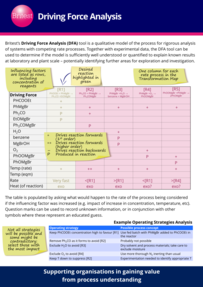
1. PurposeThe TE3PO table is a tool used to record and analyse knowledge about transformations. It is similar to a Driving Force Analysis table but was developed to capture information about parallel rate processes where the rates need to be balanced in order to deliver the desired transformations, e.g.
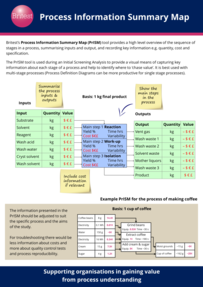
The TE3PO draws upon information captured in Rich Pictures and Cartoons, and/or Transformation Maps. It structures and summarises process knowledge to aid:
|    Printable Poster Download |
2. Information requirements
- Initial Screening Analysis identifying the problem, constraints, product properties and specifications
- Rich Pictures and/or Rich Cartoons identifying the physical phenomena occurring
- Materials taking part in each transformation
- (It can be helpful to develop Transformation Maps based on the Rich Pictures and Cartoons to clarify the sequence in which the physical phenomena occur and whether they are desirable or undesirable)
3. Procedure
3.1 Construct the TE3PO table 
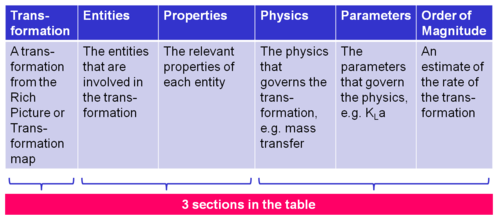
| 1. Draw a table with 6 columns headed as shown. The table is partitioned into Transformation, Entities and Properties, Physics, Parameters and Order of magnitude |
| 2. The table has one row for each transformation identified in the Rich Pictures and/or Cartoons and/or Transformation Map |
| 3. List the entities taking part in the transformation |
| 4. List the properties of each entity relevant to the transformation |
| 5. List the physics relevant to the transformation |
| 6. List the first level parameters that control each physical rate process |
| 7. Record the order of magnitude of the rate of the physical processes to facilitate balancing of rates |
| 8. In order to analyse the table controllable factors can be marked with * (or written in a different colour), factors which may change are marked with † (or written in a different colour) |
3.2 Analysing the table
Troubleshooting
- Identify key issues (likely to be associated with properties of entities involved in the transformation)
- Rank issues for potential impact on the problem under investigation - which factors are the most likely cause and why?
- For each high priority issue, identify which upstream process task controls or fixes the properties creating the problem and investigate this task in detail
Numerical modelling
- The table identifies the key physics associated with each transformation, the parameters which control the physics, and key material properties that influence the transformation
- This information can be used to inform the development of numerical models of the rate process(es) governing the transformation
Experimental planning
- Prioritise the question marked areas in the table - which information should be collected and why?
- This informs experimental planning
Page last updated 4th January 2016